Mars Visualizer

Eduardo Poyart

Back to main page


Abstract

The Mars Global Surveyor spacecraft has mapped the surface of Mars from 1996 to 2006. The surface topography was mapped using the Mars Orbiter Laser Altimeter (MOLA), an instrument on board of the spacecraft which, by means of a laser beam, computed the distance between the spacecraft and the ground several times per second.

NASA has made the result of this experiment available online. It is essentially a height map of the whole surface of Mars with a resolution of up to 128 samples per degree (512 samples per degree near the poles). Close to the equator, the resolution of 128 samples per degree is roughly equivalent to one sample every 450 meters.

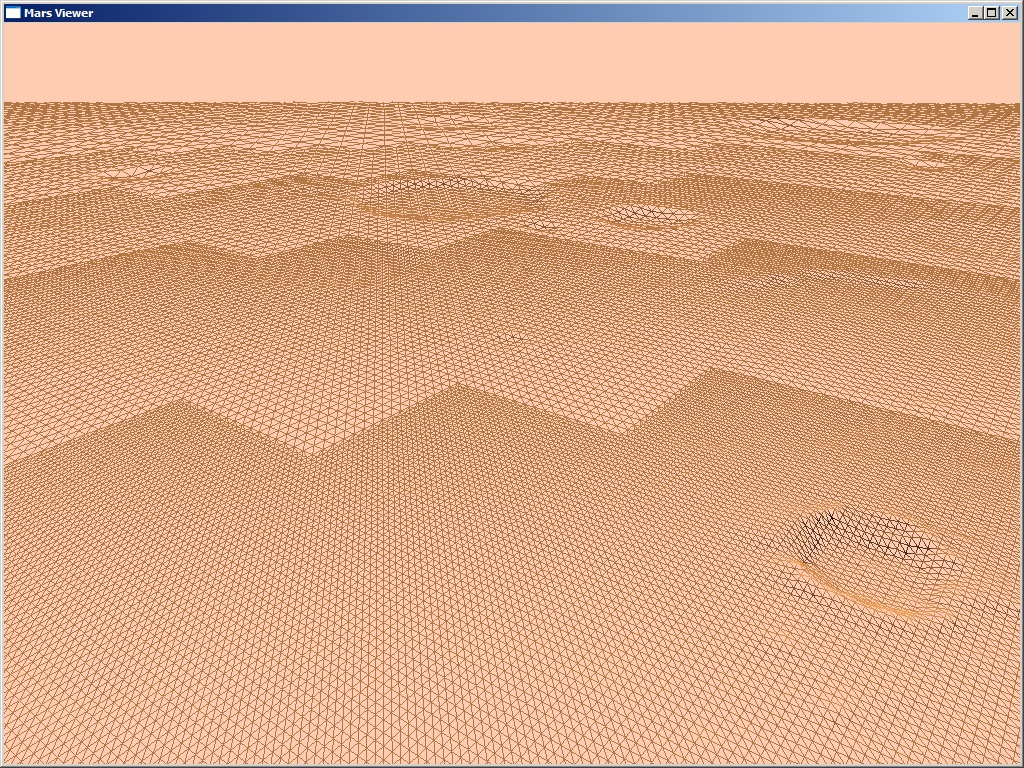
The Mars Visualizer is a tool I have developed to visualize this data set. It is a streaming Geometrical Mipmap visualizer for the MOLA data, which allows real time visualization and navigation on the surface of Mars. It has low memory requirement, not requiring that the whole dataset be available in RAM. Only the area being visualized is present in RAM, and small blocks of terrain are streamed in and out as the camera moves.

The advantages of Geometrical Mipmaps in this case are the simplicity of its implementation and the adequacy due to the fact that the source data is in the form of a regular grid.

The Mars Visualizer is a cross-platform application for Windows and Mac OS X, making use of IView, a framework that I've developed to facilitate OpenGL programming across different platforms.

Click on the images for a higher resolution view.


Overview of the Geomipmaps multiresolution method.

 Vallis Marineris.

Notice the action of Geomipmaps on the image to the left. A fan-connection algorithm properly links areas that have two different resolutions.

A pdf file with a description of the code will be available soon.